
Page 165 - Proceeding The 2nd International Seminar of Science and Technology : Accelerating Sustainable Innovation Towards Society 5.0
P. 165
nd
The 2 International Seminar of Science and Technology
“Accelerating Sustainable innovation towards Society 5.0”
ISST 2022 FST UT 2022
Universitas Terbuka
using a kitchen knife (modified by the farmer) manually and dried in
the sun for one day on a parachute covered with plastic waring or
tarpaulin. The chips are then put in sacks and stored in a clean and
shady place before being sold to collectors who come to the village.
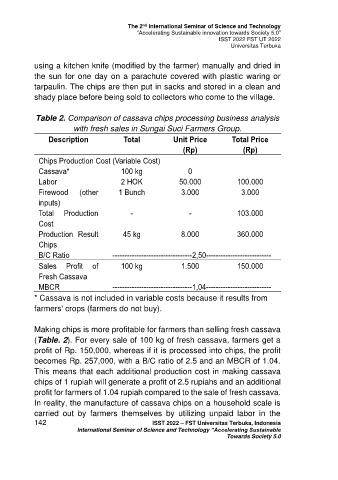
Table 2. Comparison of cassava chips processing business analysis
with fresh sales in Sungai Suci Farmers Group.
Description Total Unit Price Total Price
(Rp) (Rp)
Chips Production Cost (Variable Cost)
Cassava* 100 kg 0
Labor 2 HOK 50.000 100.000
Firewood (other 1 Bunch 3.000 3.000
inputs)
Total Production - - 103.000
Cost
Production Result 45 kg 8.000 360.000
Chips
B/C Ratio ---------------------------------2,50---------------------------
Sales Profit of 100 kg 1.500 150.000
Fresh Cassava
MBCR ---------------------------------1,04---------------------------
* Cassava is not included in variable costs because it results from
farmers' crops (farmers do not buy).
Making chips is more profitable for farmers than selling fresh cassava
(Table. 2). For every sale of 100 kg of fresh cassava, farmers get a
profit of Rp. 150,000, whereas if it is processed into chips, the profit
becomes Rp. 257,000, with a B/C ratio of 2.5 and an MBCR of 1.04.
This means that each additional production cost in making cassava
chips of 1 rupiah will generate a profit of 2.5 rupiahs and an additional
profit for farmers of 1.04 rupiah compared to the sale of fresh cassava.
In reality, the manufacture of cassava chips on a household scale is
carried out by farmers themselves by utilizing unpaid labor in the
142 ISST 2022 – FST Universitas Terbuka, Indonesia
International Seminar of Science and Technology “Accelerating Sustainable
Towards Society 5.0