
Page 52 - Proceeding The 2nd International Seminar of Science and Technology : Accelerating Sustainable Innovation Towards Society 5.0
P. 52
nd
The 2 International Seminar of Science and Technology
“Accelerating Sustainable innovation towards Society 5.0”
ISST 2022 FST UT 2022
Universitas Terbuka
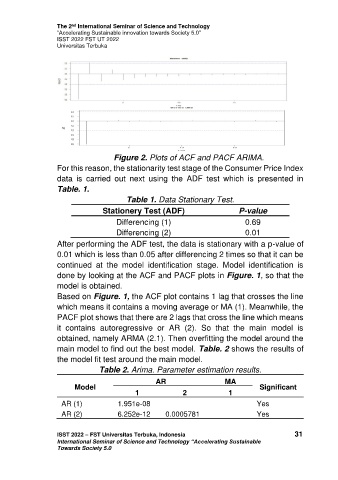
Figure 2. Plots of ACF and PACF ARIMA.
For this reason, the stationarity test stage of the Consumer Price Index
data is carried out next using the ADF test which is presented in
Table. 1.
Table 1. Data Stationary Test.
Stationery Test (ADF) P-value
Differencing (1) 0.69
Differencing (2) 0.01
After performing the ADF test, the data is stationary with a p-value of
0.01 which is less than 0.05 after differencing 2 times so that it can be
continued at the model identification stage. Model identification is
done by looking at the ACF and PACF plots in Figure. 1, so that the
model is obtained.
Based on Figure. 1, the ACF plot contains 1 lag that crosses the line
which means it contains a moving average or MA (1). Meanwhile, the
PACF plot shows that there are 2 lags that cross the line which means
it contains autoregressive or AR (2). So that the main model is
obtained, namely ARMA (2.1). Then overfitting the model around the
main model to find out the best model. Table. 2 shows the results of
the model fit test around the main model.
Table 2. Arima. Parameter estimation results.
AR MA
Model Significant
1 2 1
AR (1) 1.951e-08 Yes
AR (2) 6.252e-12 0.0005781 Yes
ISST 2022 – FST Universitas Terbuka, Indonesia 31
International Seminar of Science and Technology “Accelerating Sustainable
Towards Society 5.0