
Page 53 - Proceeding The 2nd International Seminar of Science and Technology : Accelerating Sustainable Innovation Towards Society 5.0
P. 53
nd
The 2 International Seminar of Science and Technology
“Accelerating Sustainable innovation towards Society 5.0”
ISST 2022 FST UT 2022
Universitas Terbuka
MA (1) < 2.2e-16 Yes
ARMA (1,1) 0.9684 < 2e-16 No
ARMA (2,1) 0.9685 0.9993 < 2e-16 No
The results of the ARIMA parameter estimation in Table. 2. There are
three significant models seen from the p-value smaller than alpha
0.05, namely AR (1), AR (2), and MA (1). To find out the best model
that will be used for forecasting, a diagnostic test of residual data is
carried out. There are three diagnostic tests for residual data, namely
normality test, no autocorrelation test, and homoscedasticity test.
Table 3. Diagnostic test of ARIMA model.
Normality No Autocorrelation Homoscedasticity
AR (1) 2.2e+16 0.08568 0.009436
AR (2) 2.2e+16 0.3493 0.2523
MA (1) 2.2e+16 0.8349 0.9157
The results of the diagnostic test in Table. 3. there is one model,
namely AR (1) which has the assumption that it meets the assumption
of normality, no autocorrelation, and does not meet homoscedasticity.
In other words, the model is heteroscedasticity. Therefore, it needs to
be analysed further using the ARCH-GARCH method.
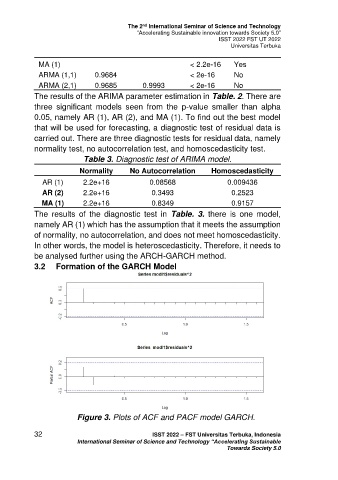
3.2 Formation of the GARCH Model
Figure 3. Plots of ACF and PACF model GARCH.
32 ISST 2022 – FST Universitas Terbuka, Indonesia
International Seminar of Science and Technology “Accelerating Sustainable
Towards Society 5.0