
Page 54 - Proceeding The 2nd International Seminar of Science and Technology : Accelerating Sustainable Innovation Towards Society 5.0
P. 54
nd
The 2 International Seminar of Science and Technology
“Accelerating Sustainable innovation towards Society 5.0”
ISST 2022 FST UT 2022
Universitas Terbuka
After estimating the GARCH model, the best GARCH model is
GARCH (1,0) because there are several significant parameters. Thus,
the GARCH (1.0) model will be a more likely model to be used in
forecasting the Indonesian Consumer Price Index for the next period,
namely 2022 and the equation from the GARCH (1.0) model is
obtained as follows:
2
=1.177e+01+ 1.000e+00 −1 2
This means that the variance of the Indonesian Consumer Price Index
in period t is found by a constant (1.177e+01) and a residual/square
residual in the previous period. The results of the diagnostic test of the
ARIMA (2,1) ~ GARCH (1,0) model that the model has been able to
handle the symptoms of heteroscedasticity is 0.9999. The LM Arch
Test has a p-value of more than 0.05, which means that the model
does not contain the ARCH effect or is free from heteroscedasticity
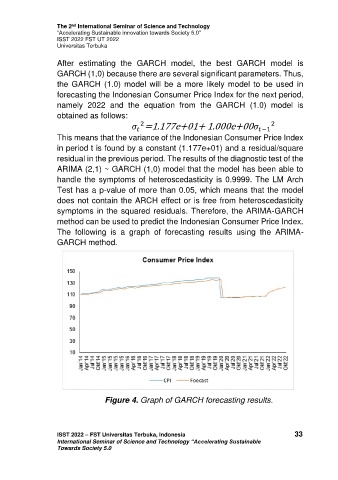
symptoms in the squared residuals. Therefore, the ARIMA-GARCH
method can be used to predict the Indonesian Consumer Price Index.
The following is a graph of forecasting results using the ARIMA-
GARCH method.
Figure 4. Graph of GARCH forecasting results.
ISST 2022 – FST Universitas Terbuka, Indonesia 33
International Seminar of Science and Technology “Accelerating Sustainable
Towards Society 5.0