
Page 51 - Proceeding The 2nd International Seminar of Science and Technology : Accelerating Sustainable Innovation Towards Society 5.0
P. 51
nd
The 2 International Seminar of Science and Technology
“Accelerating Sustainable innovation towards Society 5.0”
ISST 2022 FST UT 2022
Universitas Terbuka
.
2
2 ∑ 2
= = (7)
2
∑
= = (8)
3 RESULTS
The description of the data is done to find out the general picture of
the data that will be used for further analysis. The data used is the
Indonesian Consumer Price Index data for the monthly period starting
from January 2014 to December 2021. The amount of data used in
the formation of the model is 96 data.
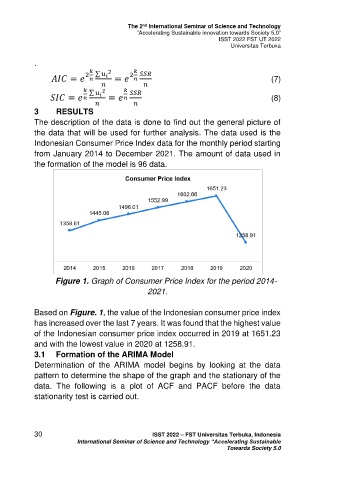
Figure 1. Graph of Consumer Price Index for the period 2014-
2021.
Based on Figure. 1, the value of the Indonesian consumer price index
has increased over the last 7 years. It was found that the highest value
of the Indonesian consumer price index occurred in 2019 at 1651.23
and with the lowest value in 2020 at 1258.91.
3.1 Formation of the ARIMA Model
Determination of the ARIMA model begins by looking at the data
pattern to determine the shape of the graph and the stationary of the
data. The following is a plot of ACF and PACF before the data
stationarity test is carried out.
30 ISST 2022 – FST Universitas Terbuka, Indonesia
International Seminar of Science and Technology “Accelerating Sustainable
Towards Society 5.0