
Page 55 - Proceeding The 2nd International Seminar of Science and Technology : Accelerating Sustainable Innovation Towards Society 5.0
P. 55
The 2 International Seminar of Science and Technology
nd
“Accelerating Sustainable innovation towards Society 5.0”
ISST 2022 FST UT 2022
Universitas Terbuka
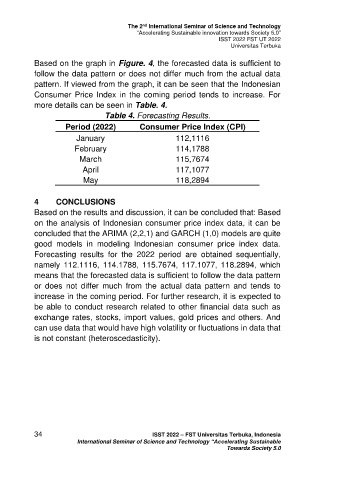
Based on the graph in Figure. 4, the forecasted data is sufficient to
follow the data pattern or does not differ much from the actual data
pattern. If viewed from the graph, it can be seen that the Indonesian
Consumer Price Index in the coming period tends to increase. For
more details can be seen in Table. 4.
Table 4. Forecasting Results.
Period (2022) Consumer Price Index (CPI)
January 112,1116
February 114,1788
March 115,7674
April 117,1077
May 118,2894
4 CONCLUSIONS
Based on the results and discussion, it can be concluded that: Based
on the analysis of Indonesian consumer price index data, it can be
concluded that the ARIMA (2,2,1) and GARCH (1,0) models are quite
good models in modeling Indonesian consumer price index data.
Forecasting results for the 2022 period are obtained sequentially,
namely 112.1116, 114.1788, 115.7674, 117.1077, 118.2894, which
means that the forecasted data is sufficient to follow the data pattern
or does not differ much from the actual data pattern and tends to
increase in the coming period. For further research, it is expected to
be able to conduct research related to other financial data such as
exchange rates, stocks, import values, gold prices and others. And
can use data that would have high volatility or fluctuations in data that
is not constant (heteroscedasticity).
34 ISST 2022 – FST Universitas Terbuka, Indonesia
International Seminar of Science and Technology “Accelerating Sustainable
Towards Society 5.0