
Page 583 - Trends in Science and Technology fo Sustainable Living
P. 583
544 Fakultas Sains dan Teknologi
Universitas Terbuka (2023)
Table 4. Annual Variability Rainfall Intensity During Sea Salt
Production
Year 2011 2012 2013 2014 2015 2016 2017 2018 2019 2020 2021
Rainfall Intensity
1.76 1.23 2.99 1.41 0.51 4.02 2.44 0.85 0.47 1.80 2.69
(mm/day)
Sumber: Hersbach et al., n.d. (ERA5 ECMWF)
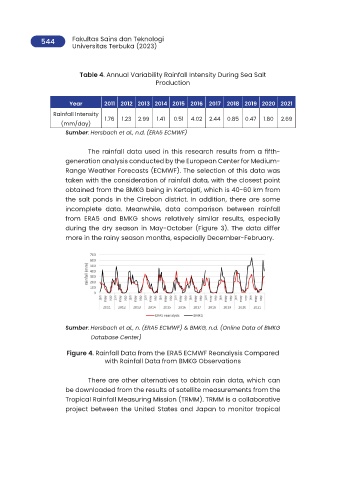
The rainfall data used in this research results from a fifth-
generation analysis conducted by the European Center for Medium-
Range Weather Forecasts (ECMWF). The selection of this data was
taken with the consideration of rainfall data, with the closest point
obtained from the BMKG being in Kertajati, which is 40-60 km from
the salt ponds in the Cirebon district. In addition, there are some
incomplete data. Meanwhile, data comparison between rainfall
from ERA5 and BMKG shows relatively similar results, especially
during the dry season in May-October (Figure 3). The data differ
more in the rainy season months, especially December-February.
Sumber: Hersbach et al., n. (ERA5 ECMWF) & BMKG, n.d. (Online Data of BMKG
Database Center)
Figure 4. Rainfall Data from the ERA5 ECMWF Reanalysis Compared
with Rainfall Data from BMKG Observations
There are other alternatives to obtain rain data, which can
be downloaded from the results of satellite measurements from the
Tropical Rainfall Measuring Mission (TRMM). TRMM is a collaborative
project between the United States and Japan to monitor tropical