
Page 582 - Trends in Science and Technology fo Sustainable Living
P. 582
Trends in Science and Technology 543
for Sustainable Living
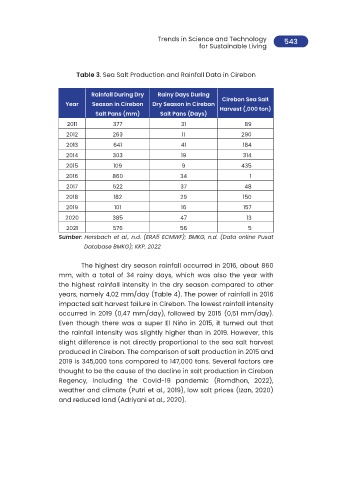
Table 3. Sea Salt Production and Rainfall Data in Cirebon
Rainfall During Dry Rainy Days During
Cirebon Sea Salt
Year Season in Cirebon Dry Season in Cirebon
Harvest (,000 ton)
Salt Pans (mm) Salt Pans (Days)
2011 377 31 89
2012 263 11 290
2013 641 41 184
2014 303 19 314
2015 109 9 435
2016 860 34 1
2017 522 37 48
2018 182 29 150
2019 101 16 157
2020 385 47 13
2021 576 56 5
Sumber: Hersbach et al., n.d. (ERA5 ECMWF); BMKG, n.d. (Data online Pusat
Database BMKG); KKP, 2022
The highest dry season rainfall occurred in 2016, about 860
mm, with a total of 34 rainy days, which was also the year with
the highest rainfall intensity in the dry season compared to other
years, namely 4,02 mm/day (Table 4). The power of rainfall in 2016
impacted salt harvest failure in Cirebon. The lowest rainfall intensity
occurred in 2019 (0,47 mm/day), followed by 2015 (0,51 mm/day).
Even though there was a super El Niño in 2015, it turned out that
the rainfall intensity was slightly higher than in 2019. However, this
slight difference is not directly proportional to the sea salt harvest
produced in Cirebon. The comparison of salt production in 2015 and
2019 is 345,000 tons compared to 147,000 tons. Several factors are
thought to be the cause of the decline in salt production in Cirebon
Regency, including the Covid-19 pandemic (Romdhon, 2022),
weather and climate (Putri et al., 2019), low salt prices (Izan, 2020)
and reduced land (Adriyani et al., 2020).