
Page 578 - Trends in Science and Technology fo Sustainable Living
P. 578
Trends in Science and Technology 539
for Sustainable Living
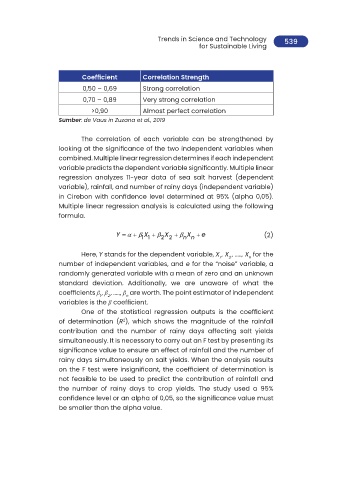
Coefficient Correlation Strength
0,50 – 0,69 Strong correlation
0,70 – 0,89 Very strong correlation
>0,90 Almost perfect correlation
Sumber: de Vaus in Zuzana et al., 2019
The correlation of each variable can be strengthened by
looking at the significance of the two independent variables when
combined. Multiple linear regression determines if each independent
variable predicts the dependent variable significantly. Multiple linear
regression analyzes 11-year data of sea salt harvest (dependent
variable), rainfall, and number of rainy days (independent variable)
in Cirebon with confidence level determined at 95% (alpha 0,05).
Multiple linear regression analysis is calculated using the following
formula.
Y = α β + X + β X + β X + e (2)
11 2 2 nn
Here, Y stands for the dependent variable, X , X , ....., X for the
1 2 n
number of independent variables, and e for the “noise” variable, a
randomly generated variable with a mean of zero and an unknown
standard deviation. Additionally, we are unaware of what the
coefficients β , β , ....., β are worth. The point estimator of independent
1 2 n
variables is the β coefficient.
One of the statistical regression outputs is the coefficient
2
of determination (R ), which shows the magnitude of the rainfall
contribution and the number of rainy days affecting salt yields
simultaneously. It is necessary to carry out an F test by presenting its
significance value to ensure an effect of rainfall and the number of
rainy days simultaneously on salt yields. When the analysis results
on the F test were insignificant, the coefficient of determination is
not feasible to be used to predict the contribution of rainfall and
the number of rainy days to crop yields. The study used a 95%
confidence level or an alpha of 0,05, so the significance value must
be smaller than the alpha value.