Page 581 - Trends in Science and Technology fo Sustainable Living
P. 581
542     Fakultas Sains dan Teknologi
                   Universitas Terbuka (2023)


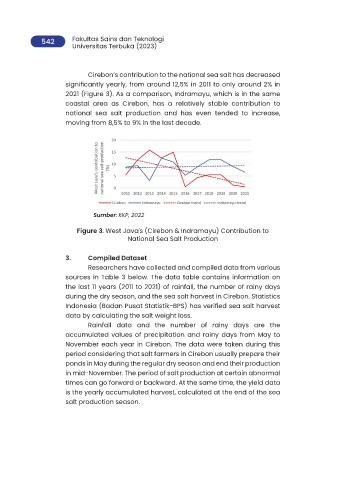
                       Cirebon’s contribution to the national sea salt has decreased
                 significantly yearly, from around 12,5% in 2011 to only around 2% in
                 2021 (Figure 3). As a comparison, Indramayu, which is in the same
                 coastal area as Cirebon, has a relatively stable contribution to
                 national sea salt production and has even tended to increase,
                 moving from 8,5% to 9% in the last decade.


                        Sumber: KKP, 2022

                    Figure 3. West Java's (Cirebon & Indramayu) Contribution to
                                 National Sea Salt Production

                 3.    Compiled Dataset
                       Researchers have collected and compiled data from various
                 sources in Table 3 below. The data table contains information on
                 the last 11 years (2011 to 2021) of rainfall, the number of rainy days
                 during the dry season, and the sea salt harvest in Cirebon. Statistics
                 Indonesia (Badan Pusat Statistik-BPS) has verified sea salt harvest
                 data by calculating the salt weight loss.
                       Rainfall  data  and  the  number  of  rainy  days  are  the
                 accumulated values of precipitation and rainy days from May to
                 November each year in Cirebon. The data were taken during this
                 period considering that salt farmers in Cirebon usually prepare their
                 ponds in May during the regular dry season and end their production
                 in mid-November. The period of salt production at certain abnormal
                 times can go forward or backward. At the same time, the yield data
                 is the yearly accumulated harvest, calculated at the end of the sea
                 salt production season.

