
Page 579 - Trends in Science and Technology fo Sustainable Living
P. 579
540 Fakultas Sains dan Teknologi
Universitas Terbuka (2023)
Root Mean Square Error (RMSE) is the magnitude of the error
rate of the prediction results, where the smaller (closer to 0) the
RMSE value, the more accurate the prediction results will be. The
RMSE value can be calculated by the following equation (Frost, n.d.)
′
n Y − Y i 2
i
RMSE = ∑ (3)
i 1 = n
RESULTS
1. Climate-weather in Cirebon
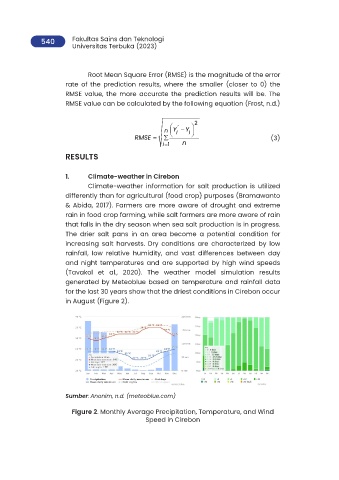
Climate-weather information for salt production is utilized
differently than for agricultural (food crop) purposes (Bramawanto
& Abida, 2017). Farmers are more aware of drought and extreme
rain in food crop farming, while salt farmers are more aware of rain
that falls in the dry season when sea salt production is in progress.
The drier salt pans in an area become a potential condition for
increasing salt harvests. Dry conditions are characterized by low
rainfall, low relative humidity, and vast differences between day
and night temperatures and are supported by high wind speeds
(Tavakol et al., 2020). The weather model simulation results
generated by Meteoblue based on temperature and rainfall data
for the last 30 years show that the driest conditions in Cirebon occur
in August (Figure 2).
Sumber: Anonim, n.d. (meteoblue.com)
Figure 2. Monthly Average Precipitation, Temperature, and Wind
Speed in Cirebon