
Page 577 - Trends in Science and Technology fo Sustainable Living
P. 577
538 Fakultas Sains dan Teknologi
Universitas Terbuka (2023)
Researchers used Microsoft Excel to statistically analyze
correlation, multiple linear regression and root mean square error.
A correlation analysis was carried out to observe the relationship
between variables that are thought to influence sea salt yields in
Cirebon. This research only takes two rain-related variables: rainfall
and the number of rainy days. The strength of the relationship
between variables is calculated using the following formula.
n n n
n ∑ XY −∑ X ∑ Y i
i
ii
r = i 1 = i 1 = i 1 = (1)
n n 2 n n 2
n ∑ X − ∑ X i nY − ∑ Y i
2
2
∑
i
i
i 1 = i 1 = i i 1 =
n = amount of data
The correlation coefficient r can be positive (+) or negative
(-) between −1 and 1. The two variables’ relationship is stronger if r
is close to −1 or 1. If the value is close to 0, the relationship between
the two variables worsens. The positive and negative signs on the
correlation coefficient indicate the direction of the relationship. A
positive correlation coefficient indicates the relationship is directly
proportional and vice versa. While the correlation coefficient is
negative, meaning the connection is inversely proportional. The
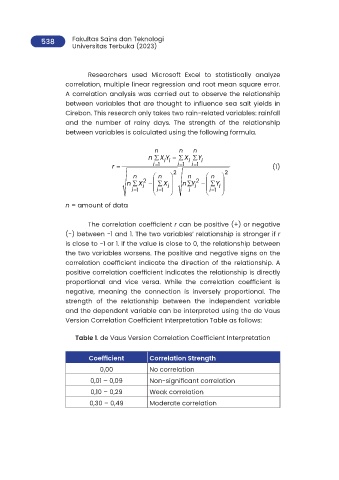
strength of the relationship between the independent variable
and the dependent variable can be interpreted using the de Vaus
Version Correlation Coefficient Interpretation Table as follows:
Table 1. de Vaus Version Correlation Coefficient Interpretation
Coefficient Correlation Strength
0,00 No correlation
0,01 – 0,09 Non-significant correlation
0,10 – 0,29 Weak correlation
0,30 – 0,49 Moderate correlation