
Page 588 - Trends in Science and Technology fo Sustainable Living
P. 588
Trends in Science and Technology 549
for Sustainable Living
rate. Technical variables such as land productivity (tons/ha) and
farmer productivity (tons/person) can also be added if the data is
available.
Table 6. Comparison of Actual Values to Predicted Results
Year Sea Salt Harvest (Y) Prediction (Y') Errors (Y-Y') RMSE
2011 88.600,0 146.182,6 57.582,6
2012 289.581,0 294.474,4 4.893,4
2013 184.046,0 55.479,4 128.566,6
2014 314.480,0 236.535,5 77.944,5
2015 435.439,0 322.603,0 112.836,0
2016 591,7 82.169,7 81.578,0 76.998,0
2017 47.885,1 93.807,2 45.922,1
2018 149.802,8 180.178,6 30.375,7
2019 157.059,4 275.966,3 118.906,9
2020 13.472,9 38.982,8 25.509,8
2021 5.368,6 40.052,8 45.421,4
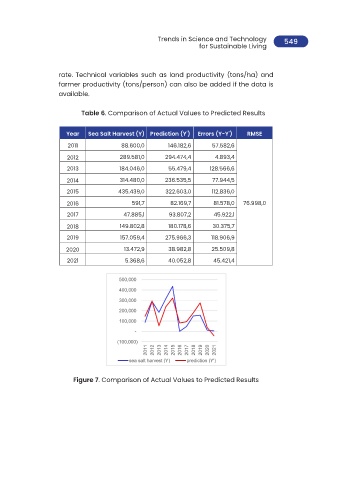
Figure 7. Comparison of Actual Values to Predicted Results