
Page 39 - Proceeding The 2nd International Seminar of Science and Technology : Accelerating Sustainable Innovation Towards Society 5.0
P. 39
nd
The 2 International Seminar of Science and Technology
“Accelerating Sustainable innovation towards Society 5.0”
ISST 2022 FST UT 2022
Universitas Terbuka
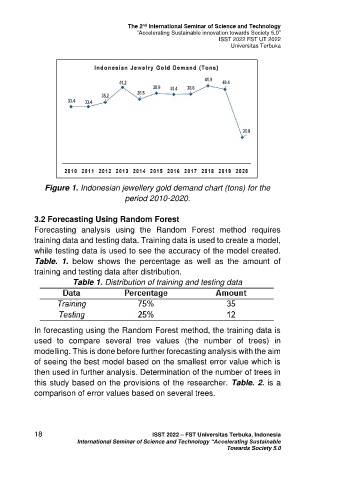
Figure 1. Indonesian jewellery gold demand chart (tons) for the
period 2010-2020.
3.2 Forecasting Using Random Forest
Forecasting analysis using the Random Forest method requires
training data and testing data. Training data is used to create a model,
while testing data is used to see the accuracy of the model created.
Table. 1. below shows the percentage as well as the amount of
training and testing data after distribution.
Table 1. Distribution of training and testing data
In forecasting using the Random Forest method, the training data is
used to compare several tree values (the number of trees) in
modelling. This is done before further forecasting analysis with the aim
of seeing the best model based on the smallest error value which is
then used in further analysis. Determination of the number of trees in
this study based on the provisions of the researcher. Table. 2. is a
comparison of error values based on several trees.
18 ISST 2022 – FST Universitas Terbuka, Indonesia
International Seminar of Science and Technology “Accelerating Sustainable
Towards Society 5.0