
Page 41 - Proceeding The 2nd International Seminar of Science and Technology : Accelerating Sustainable Innovation Towards Society 5.0
P. 41
The 2 International Seminar of Science and Technology
nd
“Accelerating Sustainable innovation towards Society 5.0”
ISST 2022 FST UT 2022
Universitas Terbuka
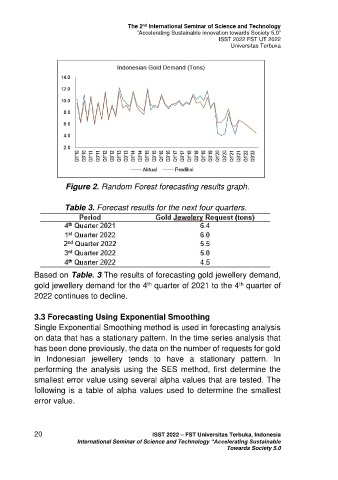
Figure 2. Random Forest forecasting results graph.
Table 3. Forecast results for the next four quarters.
Based on Table. 3 The results of forecasting gold jewellery demand,
th
gold jewellery demand for the 4 quarter of 2021 to the 4 quarter of
th
2022 continues to decline.
3.3 Forecasting Using Exponential Smoothing
Single Exponential Smoothing method is used in forecasting analysis
on data that has a stationary pattern. In the time series analysis that
has been done previously, the data on the number of requests for gold
in Indonesian jewellery tends to have a stationary pattern. In
performing the analysis using the SES method, first determine the
smallest error value using several alpha values that are tested. The
following is a table of alpha values used to determine the smallest
error value.
20 ISST 2022 – FST Universitas Terbuka, Indonesia
International Seminar of Science and Technology “Accelerating Sustainable
Towards Society 5.0