
Page 290 - Proceeding The 2nd International Seminar of Science and Technology : Accelerating Sustainable Innovation Towards Society 5.0
P. 290
he 2 International Seminar of Science and Technology
nd
“Accelerating Sustainable innovation towards Society 5.0”
ISST 2022 FST UT 2022
Universitas Terbuka
On the other hand, objects with different characteristics are said to
have dissimilarities so that the difference between the two can be
measured in the perception distance which is translated into a
perception index such as a sustainability index. The distance
determination technique is based on Euclidian Distance with Equation
(4), where d1,2 = Euclidian distance, X, Y, Z = Attribute, 1,2 =
Observation.
2
2
2
d 2 , 1 = (X 1 − X 2 ) + Y 1 2 ) + (Z 1 − Z 2 ) + ... (4)
( −Y
The euclidian distance between the two points (d1,2) then in the
MDS, is projected into a two-dimensional euclidian distance (Ḋ1,2)
based on the regression formula in Equation (5), where a = intercept,
b = slope, c = error.
D1,2 = a + b D1,2 + c (5)
In MDS, two points or the same object are mapped in a single point
that is close to each other. The technique used is the ALSCAL
algorithm and is easily available in almost every statistical software
(SPSS and SAS). Rap-gametRescue in principle makes iterations of
the regression process so that the smallest e value is obtained and
tries to force the intercept in the equation to be equal to 0 (a=0). The
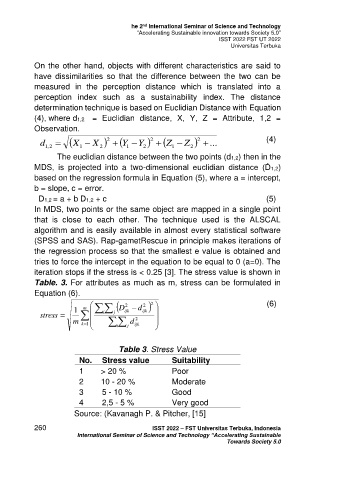
iteration stops if the stress is < 0.25 [3]. The stress value is shown in
Table. 3. For attributes as much as m, stress can be formulated in
Equation (6).
2 2 ) 2 (6)
1 m (D ijk − d ijk
i
stress = j
=
m k 1 d 2
j ijk
i
Table 3. Stress Value
No. Stress value Suitability
1 > 20 % Poor
2 10 - 20 % Moderate
3 5 - 10 % Good
4 2,5 - 5 % Very good
Source: (Kavanagh P. & Pitcher, [15]
260 ISST 2022 – FST Universitas Terbuka, Indonesia
International Seminar of Science and Technology “Accelerating Sustainable
Towards Society 5.0