
Page 367 - Proceeding The 2nd International Seminar of Science and Technology : Accelerating Sustainable Innovation Towards Society 5.0
P. 367
nd
he 2 International Seminar of Science and Technology
“Accelerating Sustainable innovation towards Society 5.0”
ISST 2022 FST UT 2022
Universitas Terbuka
supply in June of 13.0 tons. This decrease occurred due to the surge
in Covid-19 cases which resulted in a lack of central oxygen supply at
the dr. Raden Soedjono Selong.
1.5 Random Forest
Forecasting analysis using the Random Forest method requires
training data and testing data. Training data is used to create a model
and testing data is used to see the accuracy of the model. In
forecasting analysis using Random Forest, it is used as well as
comparing several Ntree values in modeling using training data. This
is done to see the best model based on the smallest MAPE value. The
following is the MAPE value based on the selection of several Ntree
values.
Table 1. Value of Ntree and MAPE Random Forest
Ntree 25 50 100 150 200 250 300 500
MAP 52.8 53.0 52.3 52.3 52.7 52.5 52.6 52.5
E 6 7 1 4 3 9 3 7
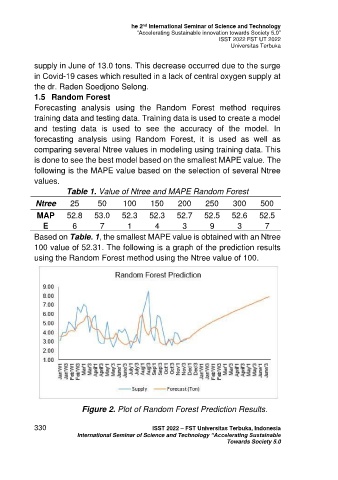
Based on Table. 1, the smallest MAPE value is obtained with an Ntree
100 value of 52.31. The following is a graph of the prediction results
using the Random Forest method using the Ntree value of 100.
Figure 2. Plot of Random Forest Prediction Results.
330 ISST 2022 – FST Universitas Terbuka, Indonesia
International Seminar of Science and Technology “Accelerating Sustainable
Towards Society 5.0