
Page 68 - Proceeding The 2nd International Seminar of Science and Technology : Accelerating Sustainable Innovation Towards Society 5.0
P. 68
nd
The 2 International Seminar of Science and Technology
“Accelerating Sustainable innovation towards Society 5.0”
ISST 2022 FST UT 2022
Universitas Terbuka
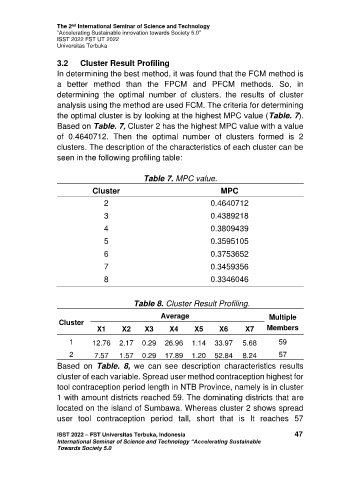
3.2 Cluster Result Profiling
In determining the best method, it was found that the FCM method is
a better method than the FPCM and PFCM methods. So, in
determining the optimal number of clusters, the results of cluster
analysis using the method are used FCM. The criteria for determining
the optimal cluster is by looking at the highest MPC value (Table. 7).
Based on Table. 7, Cluster 2 has the highest MPC value with a value
of 0.4640712. Then the optimal number of clusters formed is 2
clusters. The description of the characteristics of each cluster can be
seen in the following profiling table:
Table 7. MPC value.
Cluster MPC
2 0.4640712
3 0.4389218
4 0.3809439
5 0.3595105
6 0.3753652
7 0.3459356
8 0.3346046
Table 8. Cluster Result Profiling.
Average Multiple
Cluster
X1 X2 X3 X4 X5 X6 X7 Members
1 12.76 2.17 0.29 26.96 1.14 33.97 5.68 59
2 7.57 1.57 0.29 17.89 1.20 52.84 8.24 57
Based on Table. 8, we can see description characteristics results
cluster of each variable. Spread user method contraception highest for
tool contraception period length in NTB Province, namely is in cluster
1 with amount districts reached 59. The dominating districts that are
located on the island of Sumbawa. Whereas cluster 2 shows spread
user tool contraception period tall, short that is It reaches 57
ISST 2022 – FST Universitas Terbuka, Indonesia 47
International Seminar of Science and Technology “Accelerating Sustainable
Towards Society 5.0