
Page 29 - Proceeding The 2nd International Seminar of Science and Technology : Accelerating Sustainable Innovation Towards Society 5.0
P. 29
nd
The 2 International Seminar of Science and Technology
“Accelerating Sustainable innovation towards Society 5.0”
ISST 2022 FST UT 2022
Universitas Terbuka
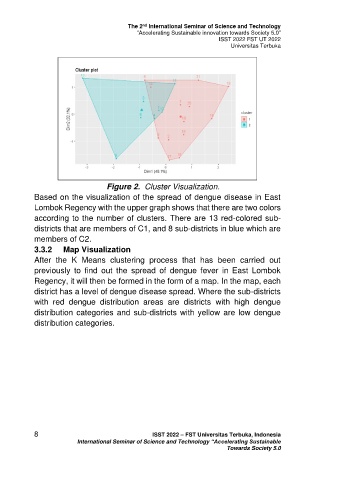
Figure 2. Cluster Visualization.
Based on the visualization of the spread of dengue disease in East
Lombok Regency with the upper graph shows that there are two colors
according to the number of clusters. There are 13 red-colored sub-
districts that are members of C1, and 8 sub-districts in blue which are
members of C2.
3.3.2 Map Visualization
After the K Means clustering process that has been carried out
previously to find out the spread of dengue fever in East Lombok
Regency, it will then be formed in the form of a map. In the map, each
district has a level of dengue disease spread. Where the sub-districts
with red dengue distribution areas are districts with high dengue
distribution categories and sub-districts with yellow are low dengue
distribution categories.
8 ISST 2022 – FST Universitas Terbuka, Indonesia
International Seminar of Science and Technology “Accelerating Sustainable
Towards Society 5.0